Pros And Cons of Working At A Startup [INFOGRAPHIC]

Entrepreneurship is on the rise. The US, as well as other parts of the globe, are turning to startups, innovators, and entrepreneurs to reinvigorate the economy. As entrepreneurship and startups become more popular, working for startups is becoming the “in” thing to do. It seems more and more MBA’s, college graduates, and even people who didn’t go to college at all are turning to startups for work rather than blue chips.

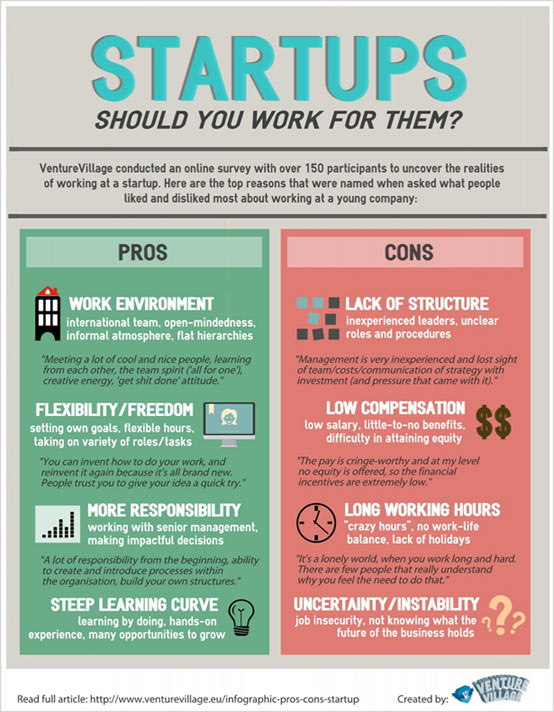
The folks over at VentureVillage have compiled an infographic that shows off the Pros and Cons to working at a startup.

The Pros are of course things like culture, flexibility, and more responsibility. Factors like low compensation, bad work/life balance, and instability top the negatives when looking at a startup job.

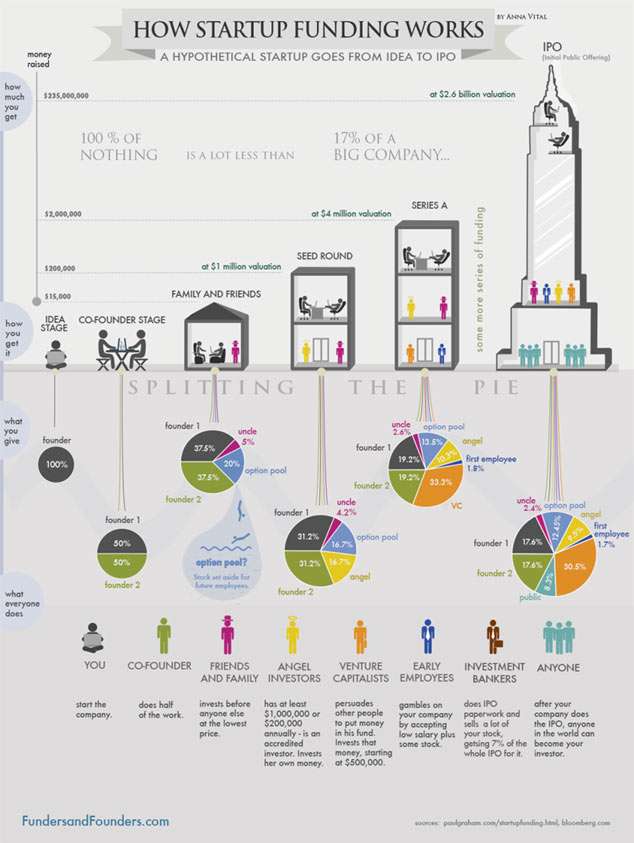
If you’re looking to work at a funded startup you may have better luck than working at a bootstrapped startup. However a bootstrapped startup may offer you opportunities a funded startup can’t, like outrageous equity.

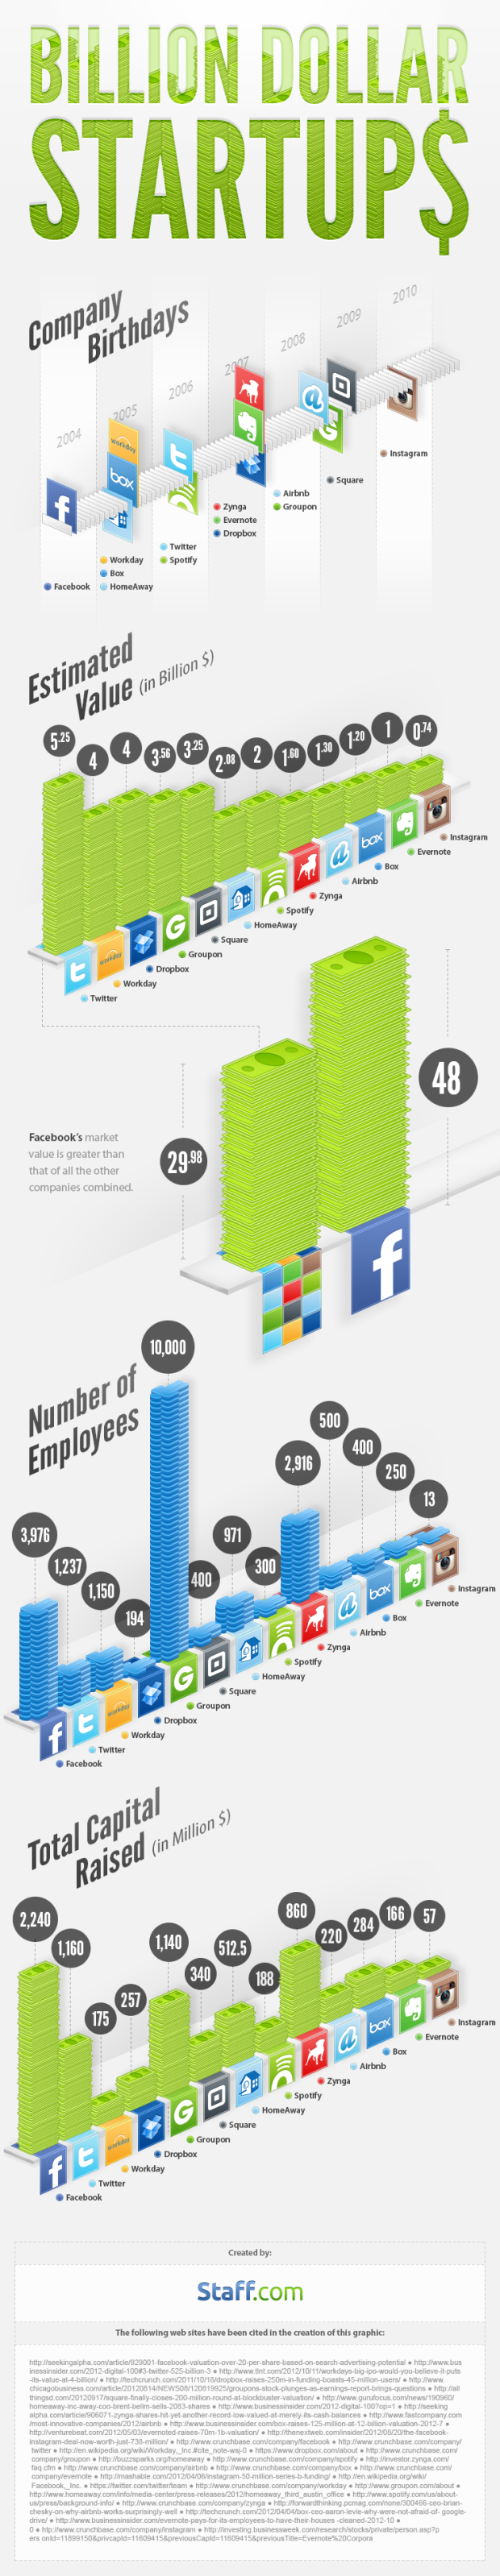
It’s apparent that working for a startup is a gamble in itself, but it could payoff. It’s hard to believe but companies like Facebook, Twitter, Instagram and even Google were at one time startups themselves. Their earliest employees are all pretty well off now.

Take a look at the infographic below and for more visit venturevillage.eu

work for a startup, startups, startup infographics


EECincyBanner

A Startup World In An Infographic

We know that startup scenes are booming across the United States, but other areas around the globe are also growing, sometimes even faster than their US counterparts. A recent infographic published by the Australian arm of Intuit highlighted the latest Startup Genome data from across the globe and found out that out of the top 20 startup ecosystems across the world, the US only lays claim to six.

Obviously Silicon Valley still ranks in at the top. That’s quickly followed by Tel Aviv which came in second. Many actually refer to Israel as the “startup country,” although most of their startup activity is concentrated in Tel Aviv.

Los Angeles, Seattle, New York, Boston, and Chicago round out the rest of the US entries in the data set.

One of the most interesting pieces of data points to the fact that many entrepreneurs are migrating away from Silicon Valley to other cities across the globe. 35% of startup founders in Waterloo, Canada previously lived in Silicon Valley. The same holds true for 33% of the founders in Singapore and 31% of the founders in Toronto.

Guess who works harder?

If working long hours is an indication of actually working harder Singapore, not Silicon Valley, takes the cake. Singapore entrepreneurs average 11 hours per day while their counterparts in Silicon Valley work an hour and a half less.

Check out all of this intriguing startup city data in Intuit’s infographic below.

Startup Cities, Intuit, Startup Infographics


EECincyBanner

How Startup Valuation Works In An Infographic

money2

If you were to ask 10 different startup founders how valuation works or how they got their valuation, you would probably end up with 10 extremely different answers. And all 10 of them probably backed by some bit of logic. As confusing at it is, valuation is probably the most important data for any startup.

Valuation is important because it determines the share of the company they have to give away to an investor in exchange for money.

“Say you are looking for a seed investment of around $100, 000 in exchange for about 10% of your company. Typical deal. Your pre-money valuation will be $1 million. This however, does not mean that your company is worth $1 million now. You probably could not sell it for that amount. Valuation at the early stages is a lot about the growth potential, as opposed to the present value.” Funders and Founders wrote on their blog.

In talking with startups everyday we hear so many different valuations. We talked  with a founder with an iPhone app that hadn’t even hit the market. They had no users, no customers, and no early funding, yet they told us they were looking at a post money valuation of $10,000,000. We’ve also seen startups that had thousands of users, legitimate press traction, and small seed rounds raised value themselves at $1 million dollars.

The infographic below from fundersandfounders.com sheds some light on valuation and how to measure a company’s potential.

The infographic details the valuation process from early stage, through scaling stage, and then through exit.

valuation, funding, startups, startup tips, infographic

EECincyBanner

Where to Find a Startup Job (Infographic)

If you read Nibletz, you’re probably interested in startup culture. You are learning about VC’s, lean methodology, exits, and IPOs. You may even have a niggling idea for a great company.

But, what if you aren’t quite ready to dive in to founding yet? This happened to me a little less than a year ago, and it’s how I met the Nibletz team. I had an idea, met with a local startup leader, started doing customer discovery and…it went flat. In my case, the idea wasn’t feasible in our area, and I wasn’t really the right person for it anyway. With 3 young kids, I didn’t feel comfortable going all in with this idea, and founders are nothing if not “all in.”

I was hooked on startups, though. I didn’t think too much about being hired by one, but when Nibletz needed an editor, I knew I would do whatever it took to land the job. For now, working at a startup is just as good as founding one. Besides contributing to a greater vision I believe in, I’m learning more every day about what it takes to start a company. I also have the freedom, for now, to play with my own ideas and research potential problems to solve.

Maybe you’re in the same boat. Love startups, but aren’t in a position to found one yourself yet. Landing a job with a startup could be a great way to prepare yourself for your future world-changing idea. The infographic below shows some great places and industries to consider when looking for that perfect startup job.

My advice, though: don’t sweat it too much if you aren’t in the “right place.” Keep your eyes and ears open, and the right job will present itself.


StartUpHire Infographic


EECincyBanner

How Startup Funding Works In An Infographic

Everyone wants to know the secrets behind getting your startup funded. We receive hundreds of emails every week asking questions about funding. People really want to know how to get funded and what a startup needs to do to get funded. Access to capital and access to talent are still the most prevalent issues facing startups “everywhere else”.

The good folks over at funderandfounders.com have compiled a great infographic that takes a look at a hypothetical startup and the way they get funded.

The infographic chronicles the most common funding steps for startups that actually make it. We’re all too familiar with the statistics on startups failing. Taking a startup through idea stage, cofounder stage, family and friends, angel round, seed round, Series A, and then eventually (hopefully) IPO.

Of course there are a lot of startups that will fail, a lot of startups that will choose to bootstrap, and some startups that can go direct to revenue. Whatever your path, the infographic below is a fair representation of the funding process.  The accompanying article at fundersandfounders explores each stage indepth.


Startup Funding, Startups, Startup Infographic


source: Fundersandfounders.com

Now check out Billion Dollar Startups In A Beautiful Infographic.

EE-FORENTREPRENEURS

Inside The Mind Of A Startup Entrepreneur [Infographic]

Top Management Degrees, a blog that serves as a guide to management degree programs, has compiled some good data that promises to take a look “inside the mind of a startup entrepreneur.”

The infographic below highlights some of the things that help a startup entrepreneur go from idea to an actual startup.  The infographic starts out by suggesting that there are two types of leaders: transactional and transformational. The transactional leader is destined to be the CEO of a well-established company, often traveling up the ladder of success. The transformational leader, on the other hand, is the one who’s cut out to “shift the paradigm”.

They’ve also assembled a wide range of quotes to support their theory about startup founders, entrepreneurs, and eventually leaders.

Does this infographic describe you? Check it out below:


Inside the mind of a startup entrepreneur, startup infographic, startup tips


Now check out Billion Dollar Startups In  A Beautiful Infographic

EE-FORENTREPRENEURS

Billion Dollar Startups In A Beautiful Infographic

Everyone wants to be the next billion dollar startup, but so far not many have been fortunate enough to get there. It takes a lot of work and huge customer adoption to even come close.

Facebook, Twitter, Square, Airbnb, and Groupon are just a few of the household names that have made it to a billion dollar valuation. If you’re curious about what it takes to get to a billion dollar valuation, Staff.com has put together a beautiful infographic outlining some key factors behind startups valued at a billion dollars or more.

The infographic takes a look at 14 startups that have been valued at a billion dollars (or really damn close like Instagram). Facebook, Twitter, Workday, DropBox, Groupon, Square, HomeAway, Spotify, Zynga, Airbnb, Box, Evernote, and Instagram are all featured in the infographic.

One of the most interesting facts in the research is that Facebook has a market value that is greater than all of the other companies combined. Wow!

Another very interesting fact is number of employees. Facebook has nearly 4,000 employees and Instagram (now part of Facebook) has just 13. DropBox, which ranked 4th on the list by valuation has 194 employees, and Zynga which ranks 9th has nearly 3,000 employees.

If you’re thinking a billion dollar valuation would sure be nice, check out the infographic below:

Billion Dollar Startup, Staff.com, infographic


Staff.com also chronicled the failure of startups in this infographic.

EE-FORENTREPRENEURS

The Evolution Of Chicago’s Tech & Startup Scene In An Infographic

chicagoWe travel all across the country and check out startup communities and ecosystems everywhere else. One of the ones that caught our eye early on is Chicago.

Going back to the early 1900’s Chicago has had hustle. Much like many don’t want to succumb to the fact that drug kingpins (the ones that don’t get caught) are the grittiest of hard working entrepreneurs, Chicago has heart, hustle and loyalty that can date back to the seedy underworld that once played home to the most notorious of gangsters Al Caone and later Sam Giancana.

Why in the world did I go there? First off it’s history but secondly the Chicago startup ecosystem is an extremely loyal bunch. They help each other in good and bad and they lift each other up whenever and where ever they can. That’s why, despite the fact that Chicago produces 100 startup events a month, the entire community comes out for Chicago TechWeek.

Staples in industry like United Airlines, Fannie May and Sears grew up in Chicago, with countless others.

And then when technology took off (and despite what PandoDaily once said) BOOM! Chicago’s tech ecosystem and infrastructure skyrocketed which is still what it’s doing today.

Most recently we know the stories of GrubHub and Groupon but back in 1984 (yes 1984 before many startup founders were born), IT mail order powerhouse CDW was founded in Chicago. Millions of people have bought computers, storage, printers and other peripherals from the three letter giant.

Chicago also revolutionized and re-invented the classifieds department across multiple categories starting with CareerBuilder in the mid 90’s. Then in the late 90’s cars.com and apartments.com launched, in Chicago.  Chicago also has one of our favorite regional startup sites to visit, builtinchicago.com.

Let us also not forget that Motorola is based right outside of Chicago.

All of this is why one of Chicago’s other big startups, BigMarker, went ahead and made this trusty infographic highlighting the history of Chicago’s Tech Scene as a celebration of their tech community on TechWeek.

Oh and regardless of size, Chicago holds one mean tech party during TechWeek second only to the VegasTech party at SXSW.

chicagoinfographic-thumb


Click here to actually read or print this thing (enlarge)

Here’s more Chicago Techweek startup coverage.

CTW-ELEVATELONG

The Failure Of Startups In An Infographic By Staff.com

We all know that startups are up against a stacked deck. Depending on your source, startups fail at rate of anywhere form 70% – 90%. Startup founders are often big risk takers and know that to get their idea to the masses, it’s going to take hard work.

The folks at staff.com have released the infographic below that, while bright and colorful, paints a dark picture for people who consider themselves entrepreneurial and venture out on their own.

The timing of the infographic is a bit convenient as well. Just Saturday we published an infographic from our friends at oDesk highlighting that 72% of people with “real jobs” want to quit and be entirely independent. Further, 61% say they’re likely to quit within 2 years.

oDesk is a platform connecting free-lancers with any background to those needing workers. oDesk is enabling startups across the globe to stay in their hometowns by offering remote workers from developers and designers to administrative professionals.  Naturally, the lifeline of oDesk’s business is people working for themselves. oDesk is a huge resource for startups and entrepreneurs. They are also a good friend to startups “everywhere else”

Staff.com on the other hand, is a much more traditional firm. They help match employers with employees, so the lifeblood of their business is to keep people in traditional positions. No fault there; people have to work.

We all know “stats” can be skewed. Which infographic do you resonate with more?


Staff.com, odesk, everywhereelse, startups,entrepreneurs


Check out this advice for startups everywhere else from oDesk CEO Gary Swart

EE-FORENTREPRENEURS

How Hot Are Collaborative Economy Startups [infographic]

Collaborative economy, Sharing economy, infogrpahic

EE-FORENTREPRENEURS

Next to loyalty and rewards, the “shared economy” or “collaborative economy” is probably the second hottest space in startup land. Startups that encourage borrowing, bartering, ride sharing, or swapping are often categorized in the collaborative economy. Startups that facilitate a direct transaction between Person A and Person B–whether it be with services, money, or goods–fall into the shared economy.

RidePost, Airbnb, FlightCar, ToySwap, and the hundreds of others like them are collaborative economy startups.

Jeremiah Owyang, an analyst with the Altimeter Group, has been tracking this hot trend in startups since February. He compiled this awesome list of 200 startups that fit into the “collaborative economy” category.

On Friday Owyang released Altimeter’s latest findings along with a great infographic outlining how hot the collaborative space is. They polled the 200 startups in the list linked above to see how they were spreading across many verticals and released some important findings.

According to Altimeter’s research, entrepreneurs are entering into the collaborative space with new startups because the cost of getting into the space is rather low. They also seem to be the hot space that VC’s are looking into, and of course there’s the “sharing” and “helping” your fellow man appeal of collaborative startups.

While Owyang seems bullish on the collaborative space, that optimism comes with many warnings. The first thing that he cites is the fact that each collaborative vertical has 5-15 startups doing the exact same thing.

“I see 5-15 startups in nearly every category, for examples a variation of car share ownership, shared car usage, shared car services, and more being offered.” Owyang said on his blog.

Owyang also points out that many startups are looking to either partner with major companies the way Relayride is partnering with GM for OnStar, get acquired by major companies the way ZipCar got acquired by Hertz, or disrupt major companies or industries, the way Airbnb does for hotel chains.

The one thing he doesn’t comment on is the legal snafus that these startups are getting into. In most cases, like the case with FlightCar, the major companies being disrupted by these collaborative economy startups are fighting back with lawsuits.

If your startup is in the collaborative or sharing space Owyang’s entire series of posts on the topic are great reads.

The infographic below, chronicles the rise of the collaborative economy.

Research themes 2013F2


Now check out this infographic: Is The Gender Gap In Women Funded Startups Closing?

serious

Today Entrepreneurship Is A Mindset, oDesk Infographic Reveals!

Southland, infographic, startup,odesk,Gary Swart

Although some are suggesting that the worst is behind us in the current economy, the situation over the last 10 years sent more and more people into freelance and entrepreneurship. People found that they could no longer look for a job; they needed to create one.

That’s one of the things that’s driven the success of oDesk, a marketplace for just about anyone with any skill that can be done on a computer.

While many websites and companies devoted to remote working have an emphasis on development, design, and programming, oDesk is different. In fact, any startup anywhere could find the workforce they need via oDesk, right from their own hometown. Whether you’re looking for software developers, engineers, business development people, researchers, administrative handlers, or PR people, you’ll find them on oDesk.

Since 2005 oDesk has been one of the driving forces behind remote working.  Now millions of people have been connected to jobs across the street, or around the world through the power of oDesk.

As more and more people turn to freelancing and remote work, oDesk released this very interesting infographic that shows not only are they onto something, but freelancing, remote work, and entrepreneurship are rising at a lightning fast paced.

According to their research, today 90% of people think that entrepreneurship is a mindset rather than starting a company. With that in mind, oDesk has found that 72% of people still in “regular jobs” want to quit to be entirely independent. 61% have said they’re likely to quit within 2 years.  Freedom seems to be the driving force behind this trend.

Check out this very interesting infographic below, and if you’re looking for [fill in the blank] check out oDesk.com


entrepreneurmindset-odesk


Check out the welcome PandoDaily’s Sarah Lacy gave oDesk CEO Gary Swart at the Southland Conference.

EE-FORENTREPRENEURS

Revealed: What It Takes To Get A Top 10 Rank In The Apple App Store

With so many mobile-first and mobile-focused startups in the world these days, one of the biggest hurdles startups and app developers have is breaking the highly coveted Apple App Store Top 10. With many startups, that are truly starting from the beginning, without the help of a rock star team, cracking the top 10 can make or break a company.

Reading those words may be scary, but that’s the breaks with literally millions competing in the same space.

Trademob analyzed 72 campaigns conducted over an eight month period from August 2012 to March 2013. The analysis revealed average CPI’s (cost per install), during boost campaigns as well as data about the required volume of installs necessary to achieve a position in the top 10 of Apple’s App Store in each country.

Trademob found that installs required for top 10 status in the “free” chart for Apple’s App Store in the US were 3x as high than the UK, the next ranking country. Likewise the US also had the highest cost per install.  They also discovered was that even if an app cracked the top 10 in the UK, Germany, France, Italy, and Spain, they still wouldn’t necessarily have the installs needed to crack the U.S. top 10.

The data set specifically looked at boost campaigns and their effect on app installs for iOS. It also highlights the “organic uplift” achieved from a boost campaign.

” In order to rank in the top 10 of the iOS App Store, an app must achieve a high number of downloads within 72 hours. App marketing boost campaigns can boost an app’s ranking by generating (buying) large numbers of downloads in a short amount of time. The downloads achieved during the last 24 hours have the biggest impact on the ranking position”. Trademob wrote.

If you’re an app developer and a mobile focused or mobile first startup, check out the data below.


Mobile tips, iOS tips, iOS rank, startup tips, TradeMob, Infographic


Now check out this infographic: 10 Rules For A Great Startup Idea

nibpartner1


EdTech Startups Here’s How K-12 Students Are Using Technology [INFOGRAPHIC]

EdTech, Education Startups,Technology in the classroom, startup, InfographicEdTech startups are on the rise. More and more educational institutions, universities, school systems and students are using technology to assist with learning, student privacy, teaching aids and more. Educationweek.com recently polled 1600 teachers and administrators in K-12 schools to determine how well their schools are using digital technologies.

The infographic below provides a snapshot of technology in the classroom as well as how students are embracing mobile technology.

According to Piper Jaffray’s 23rd semiannual “Taking Stock With Teens” report 34% of teenagers already own a tablet computer. A whopping 86% of teenagers say their next device will be a smartphone.

On the school side privacy and security seem to be the biggest area for technology in K-12 schools. Personal e-portfolio’s for students had the lowest ranking in data compiled by The Software and Information Industry Association “Vision K-20 Survey”.

Probably the most interesting, and positive data was among school districts. According to the Center For Digital Education’s “2011-2012 Digital School Districts Survey” of respondents, 65% of school districts have some kind of digital content strategy. 67% of school districts have data dashboards in place and 76% have a classroom technology standard.

How does your EdTech startup fit in? Check out the infographic below and you decide!

K12Technologyuse


Check out this Florida startup that is working on the first ever educational MMORPG

EEBOTHDiscount

Canadian Startup TagMyDoc Releases Sweet Infographic! [no really]

Last month we got the chance to talk with the founders behind New York startup Docurated. They were pitching on the battlefield stage at TechCrunch Disrupt NY.  Their idea is to provide enterprise with a way to easily search and find content within volumes and volumes of files, information, and presentations wherever it’s located.

Last October, we interviewed the team behind Canadian startup TagMyDoc. Their simple, easy to understand platform does almost the same thing, but they’re positioning it for everybody.

In looking at the two products side by side Docurated seems perfect for what it’s designed for. I’d say their best use cases would be big PR Firms and marketing units within big enterprise companies where multiple people are collaborating on projects and need to be able to quickly search through excerpted content.

TagMyDoc lets you organize your content, wherever it lives, whatever way you want. I like this for a lot of reasons too, customization being the number one reason. From a user like me though, this can be overwhelming at times because sometimes I forget how I organize stuff. Take my mess of Gmail folders for instance.

At any rate, TagMyDoc has come a long way in the last 7 months since we interviewed them and just in time for summer they’ve released this really “sweet” infographic on how far they’ve come.


TagMyDoc, Canadian startup,infographic


See I told you it was sweet.

You know what we like for organizing, this is the startup we like for mobile email.

nibpartner1